

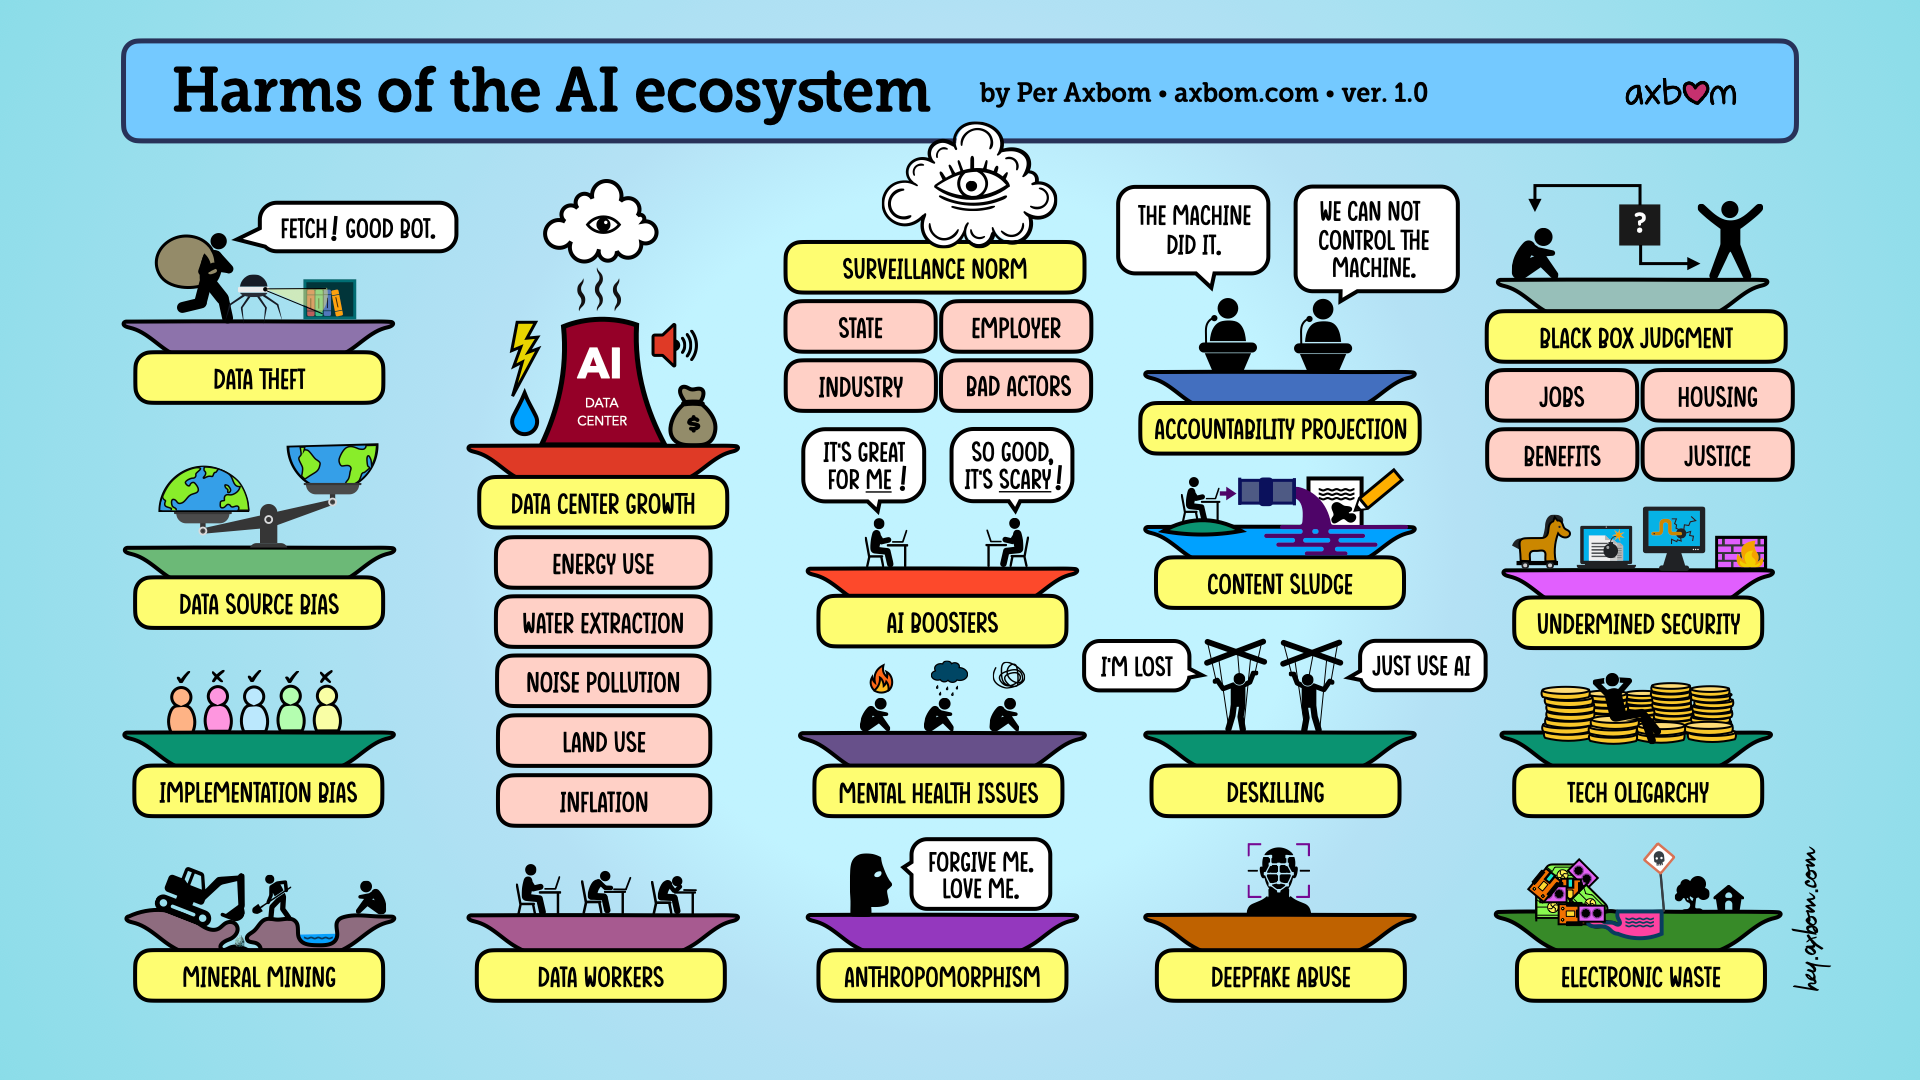
A challenge when looking at "AI" development with a critical eye, and articulating that critique, is how the technology affects so many areas of society. Locally and globally. It affects individual wellbeing, interpersonal relationships, and exposure to abuse and crime. I want to help more people grasp the full picture of permutations going on, without being bewildered by the many tentacles of the technology.
In this infographic, I map out islands of harmful manifestations that are all interconnected with what falls under the umbrella term "AI" as it is widely used today. The areas range all the way from data theft and mineral extraction to black box judgment, undermined security, and e-waste.
The purpose of the image is to facilitate conversations and decisions around how to relate to, and regulate, the technology. I also hope to contribute to acceptance and understanding of a reluctance to fully embrace it. If we don't grapple with these phenomena but simply insert ourselves uncritically into them, and ignore the suffering, then perhaps change will happen faster. But that change can hardly be described as "for the better".
The times we live in are marked by…
- the inability of public leadership to see, and take seriously, all aspects of the impact "AI" development has on people,
- a wide-ranging exposure to "AI"-driven algorithms and decisions that affected citizens have very little insight into, or even awareness of,
- and an abysmal freedom allowing large tech companies to claim almost anything about "AI" and its capabilities, immense leeway when creating the technology, along with practically nullified responsibility for far-reaching harmful impacts on people and communities.
My wish is that as many of us as possible help shed light on the wide variety of risks and consequences, so that more people understand and can act in support of their own and their communities' shared interests. I spend many hours experimenting with formats for realising this communication, and my evenings devoted to drawing infographics is part of this effort.
The graphic hopefully looks simple enough, as is the intent, but I've been working on it for two months, and there's a lot of anguish and agonizing over both word choice and illustrations. And over what is not included. Hence I can justify these decisions because they are my own, thus empowering myself and the value of the graphic.
If you find them useful, you are of course welcome to use all my templates, diagrams, and visualizations in your own presentations, training sessions, and work meetings. It's also not wrong to ask for permission, to let me know when they're being used, or to express wishes for additions and edits. I love hearing about all the contexts these works appear in, which spurs me on to do even more.
Perhaps these images will also help you see connections and impacts that I haven't noticed myself yet. Please share!
Download the graphic in PDF format
More languages
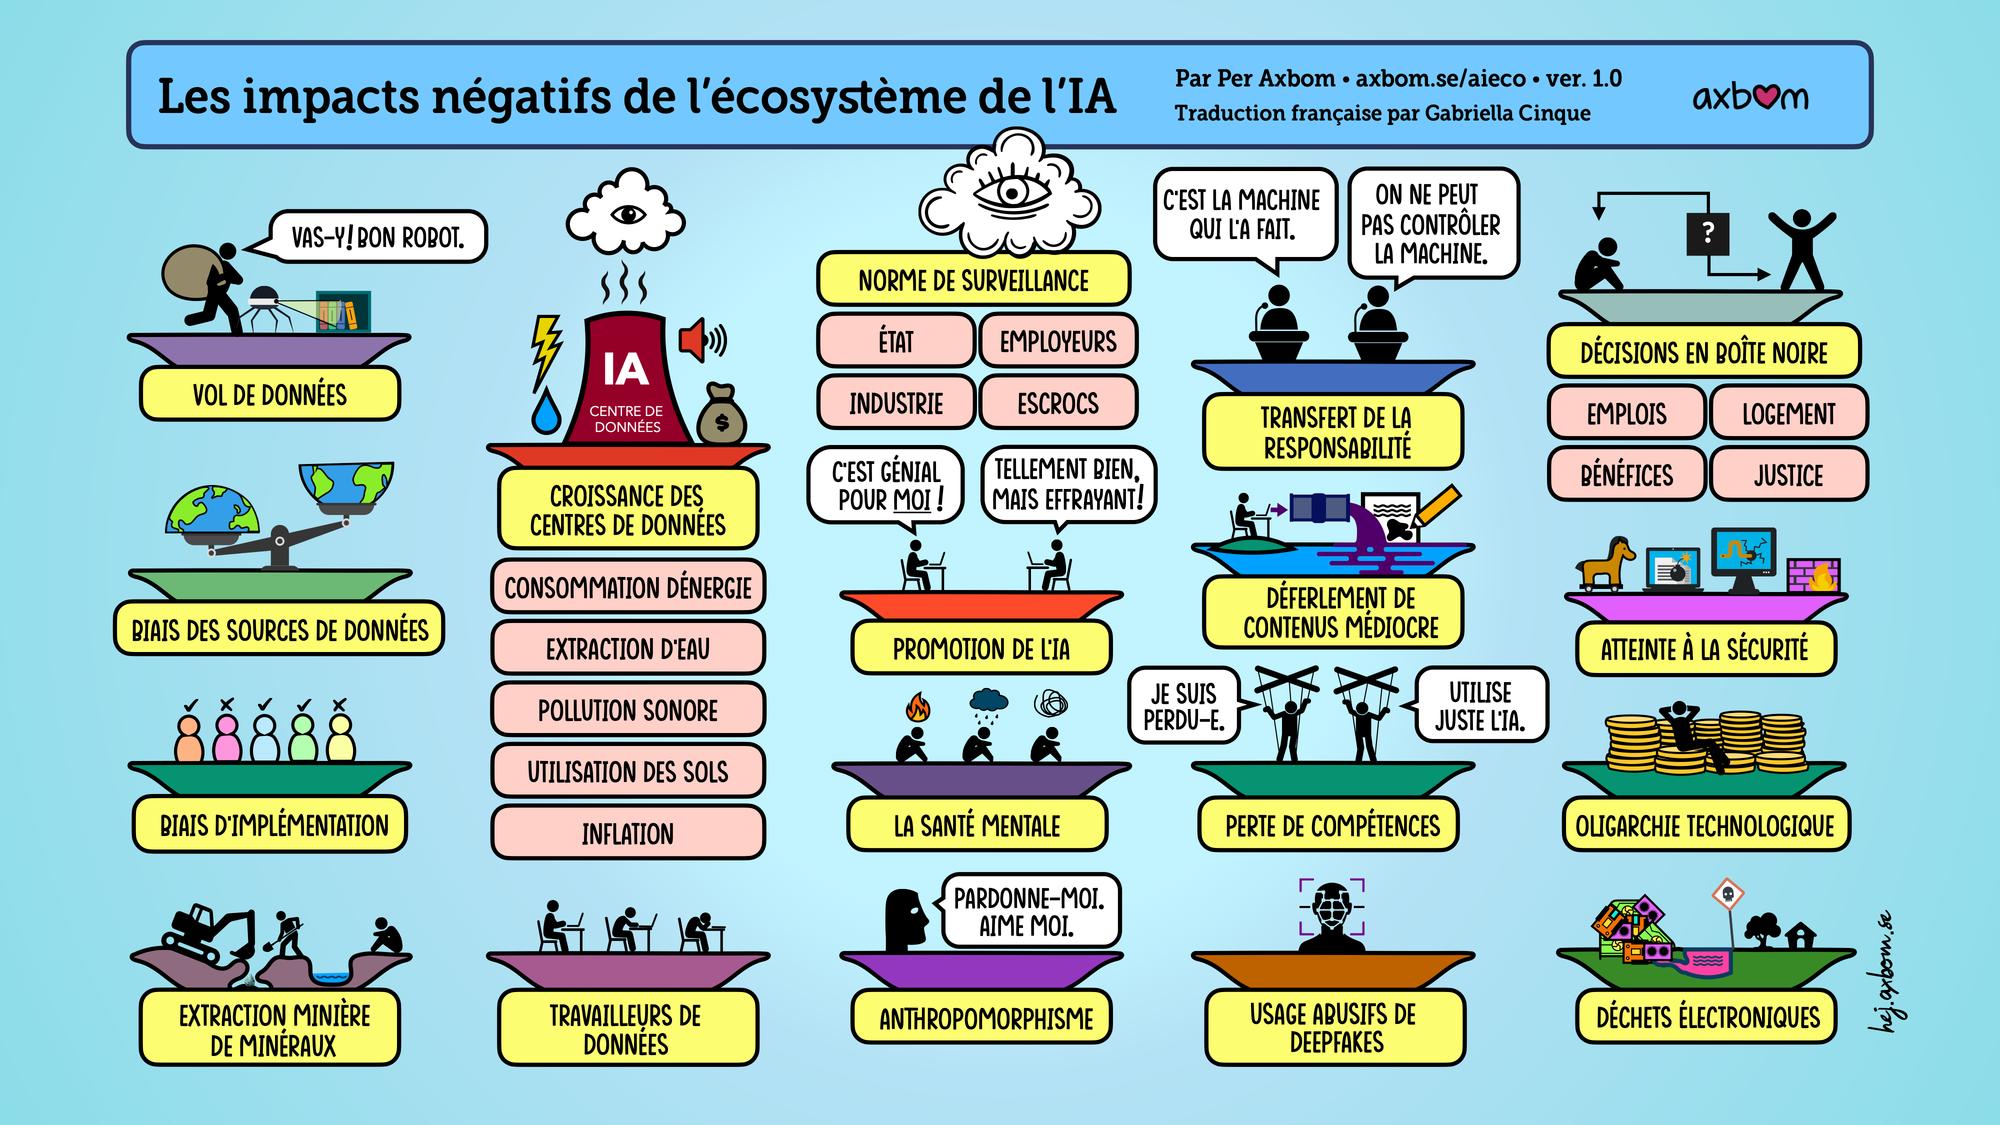
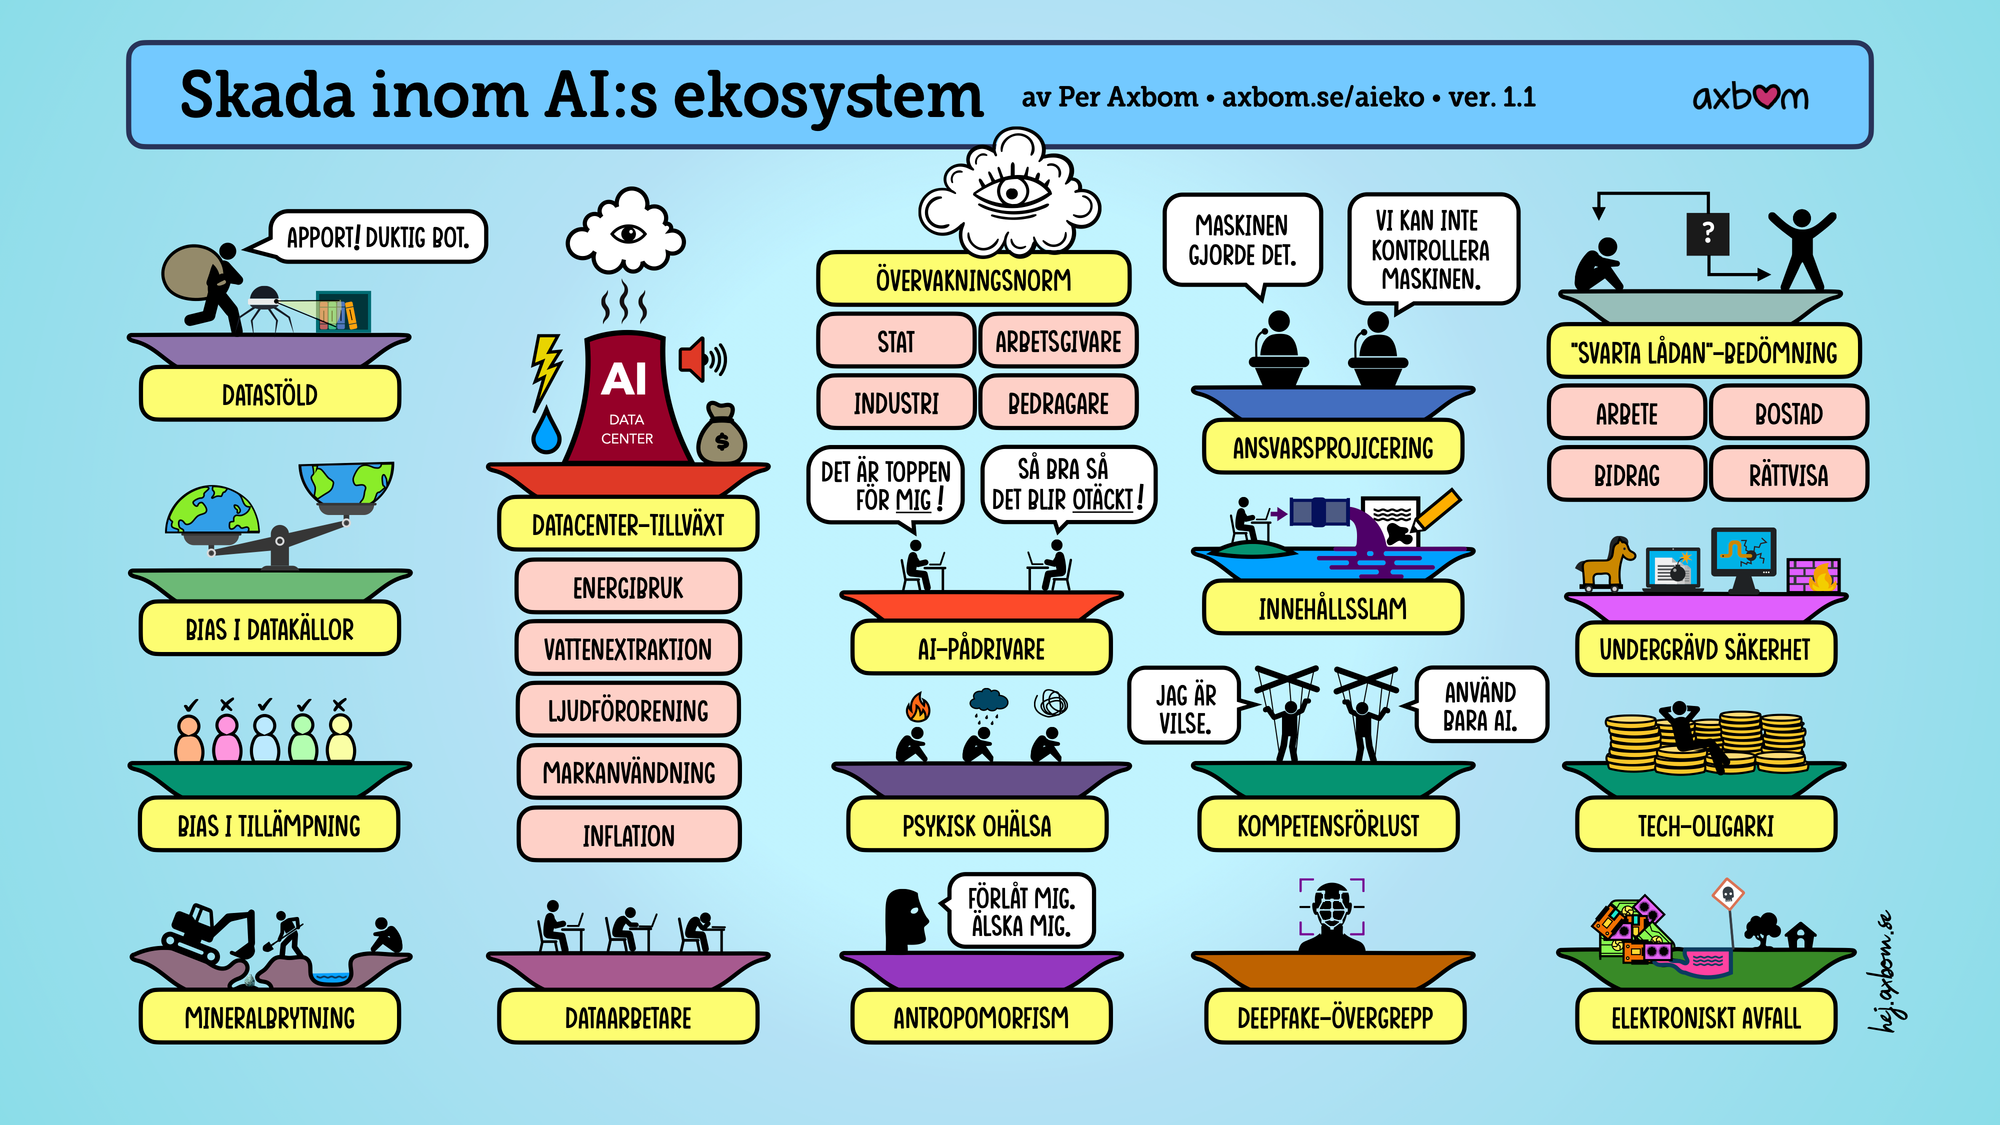
The infographic in French and Swedish variants.
French
Swedish
Are you interested in translating?
I suggest you use the image description for the full text content of the graphic, and then send me your translation along with the your full name so I can credit you in the image.
In my newsletters I touch on examples from all of the areas in the graphic. In earlier texts and talks I've gone into more detail on what several of them mean and how they can be addressed and managed. Below, I offer suggestions for further reading on my blog.
Further reading
My earlier texts, models and templates related to "AI" impact.
 Per Axbom
 Per Axbom
 Per Axbom
 Per Axbom
 Per Axbom
 Per Axbom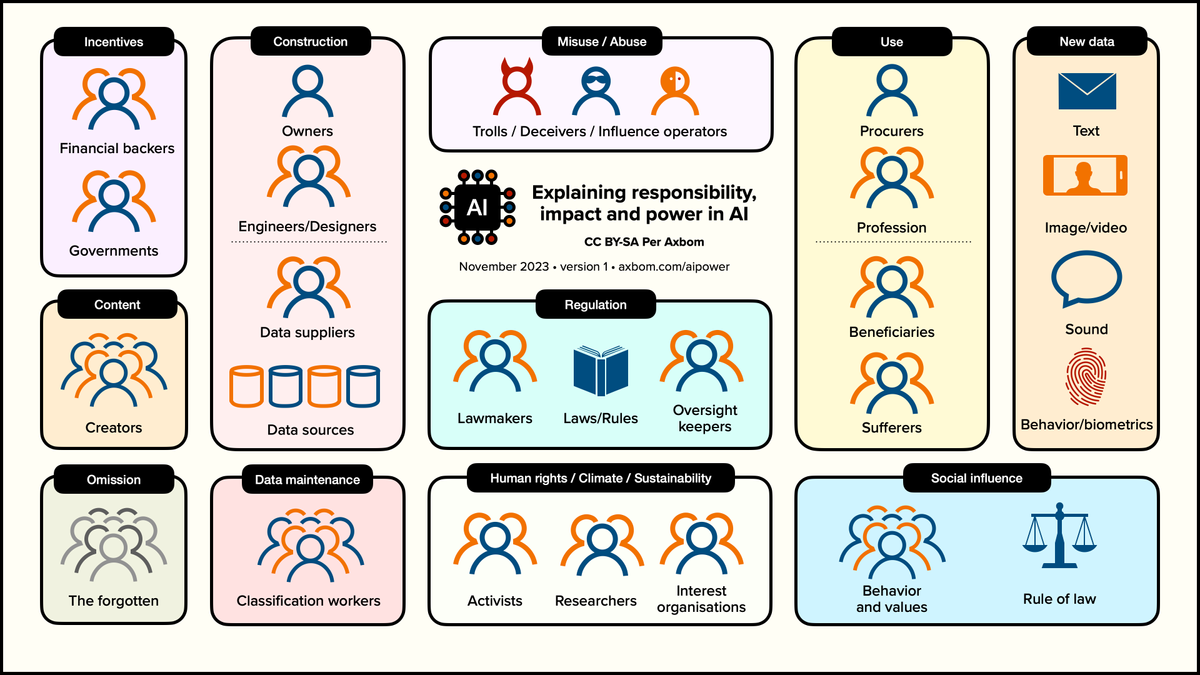
 Per Axbom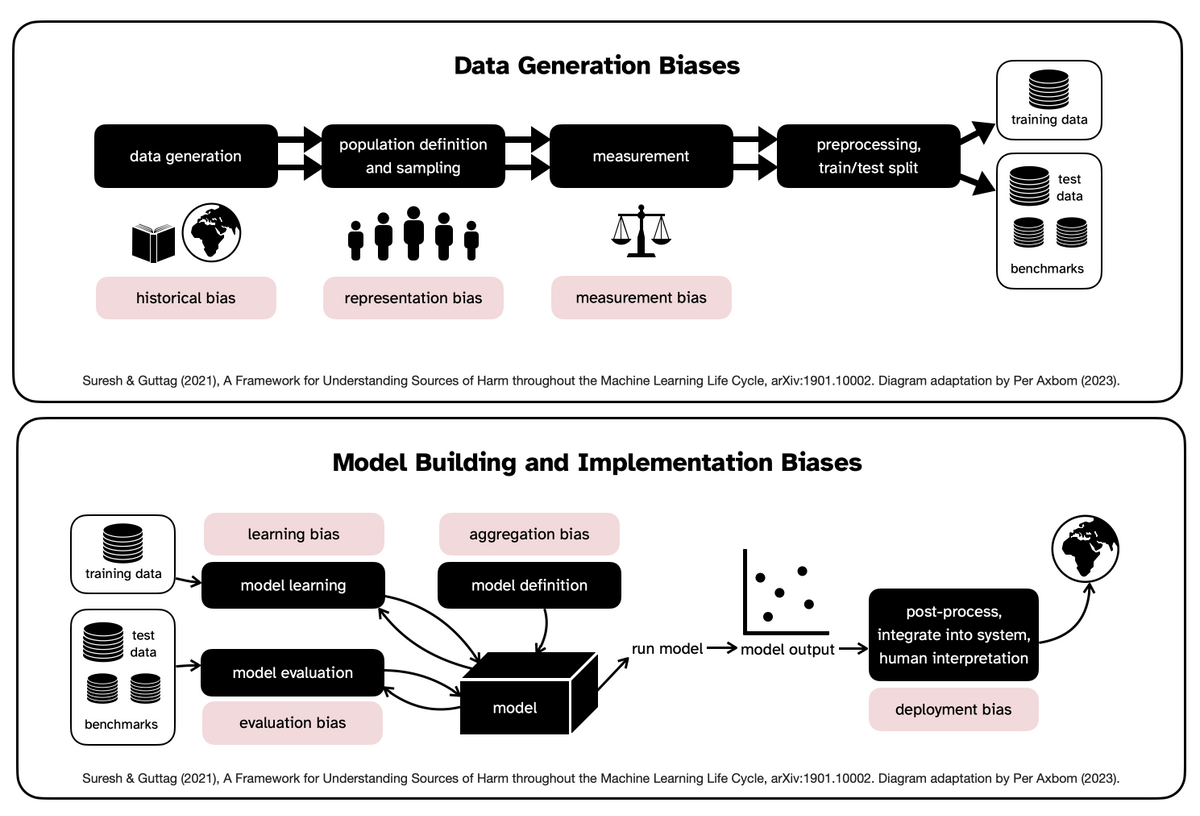
 Per Axbom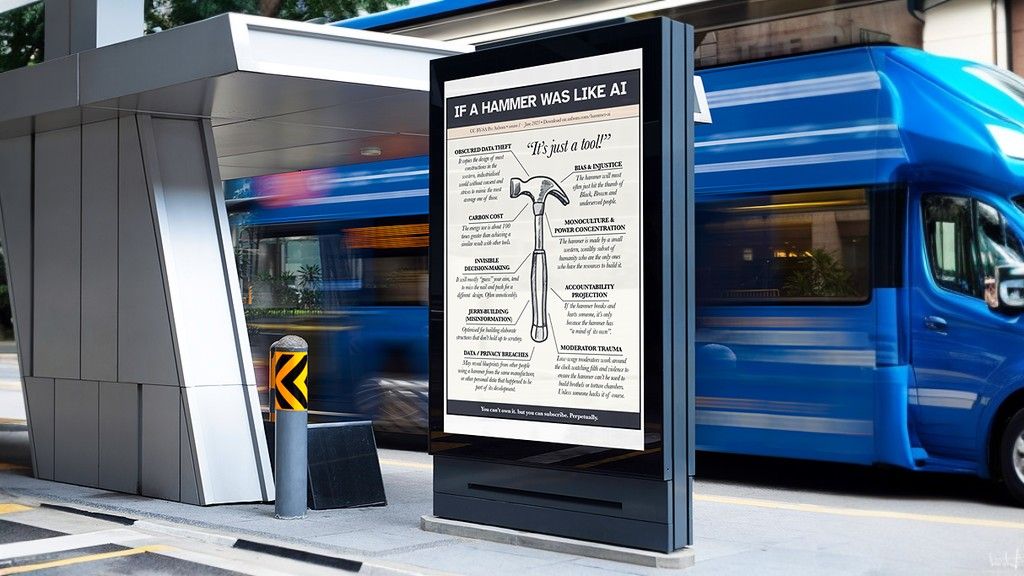
 Per Axbom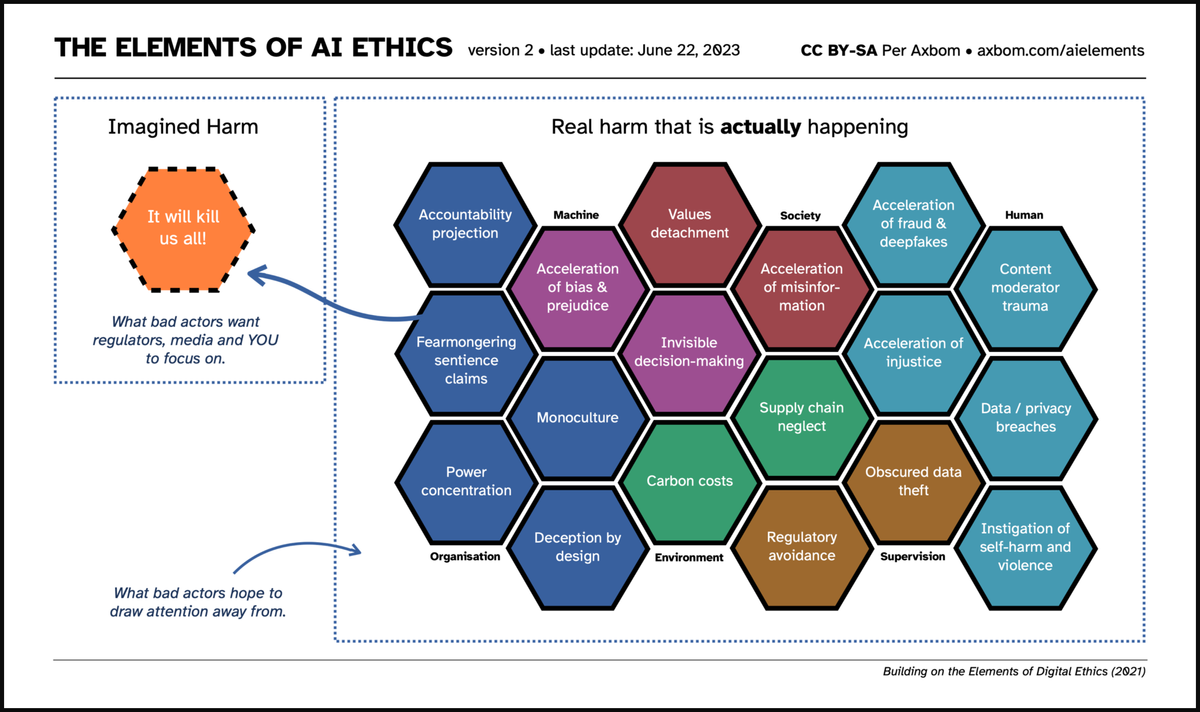
 Per Axbom
 Per Axbom
 Per Axbom
Books
Reading books is an important part of cultivating a capacity for critical thinking. These books have my warmest recommendations.
- The AI Con (2025), Emily M. Bender & Alex Hanna
- The Age of Surveillance Capitalism (2019), Shoshana Zuboff
- Empire of AI (2025), Karen Hao
- The Nerd Reich (2026), Gil Durán
- Privacy is Power (2022), Carissa Véliz
- Prophecy (2026), Carissa Véliz
- Unmasking AI (2024), Joy Buolamwini
Image description
For those who want an image description of the infographic, it's available on its own page.
Addendum
Trivia: The font used for the "islands" is called "Alone On Earth." I made a donation to its creator, Amry from Indonesia. The headline font is "Eacologica Round Slab," which I purchased from Defharo. Don't forget to support font creators! ❤️